New SEIA report shows solar momentum, despite short-term declines

The Solar Energy Industries Association’s (SEIA) new Solar Market Insight (SMI) report, developed in conjunction with data firm Wood Mackenzie, shows the American solar and storage industry is on relatively solid ground despite consistent political headwinds at the federal level throughout this year.
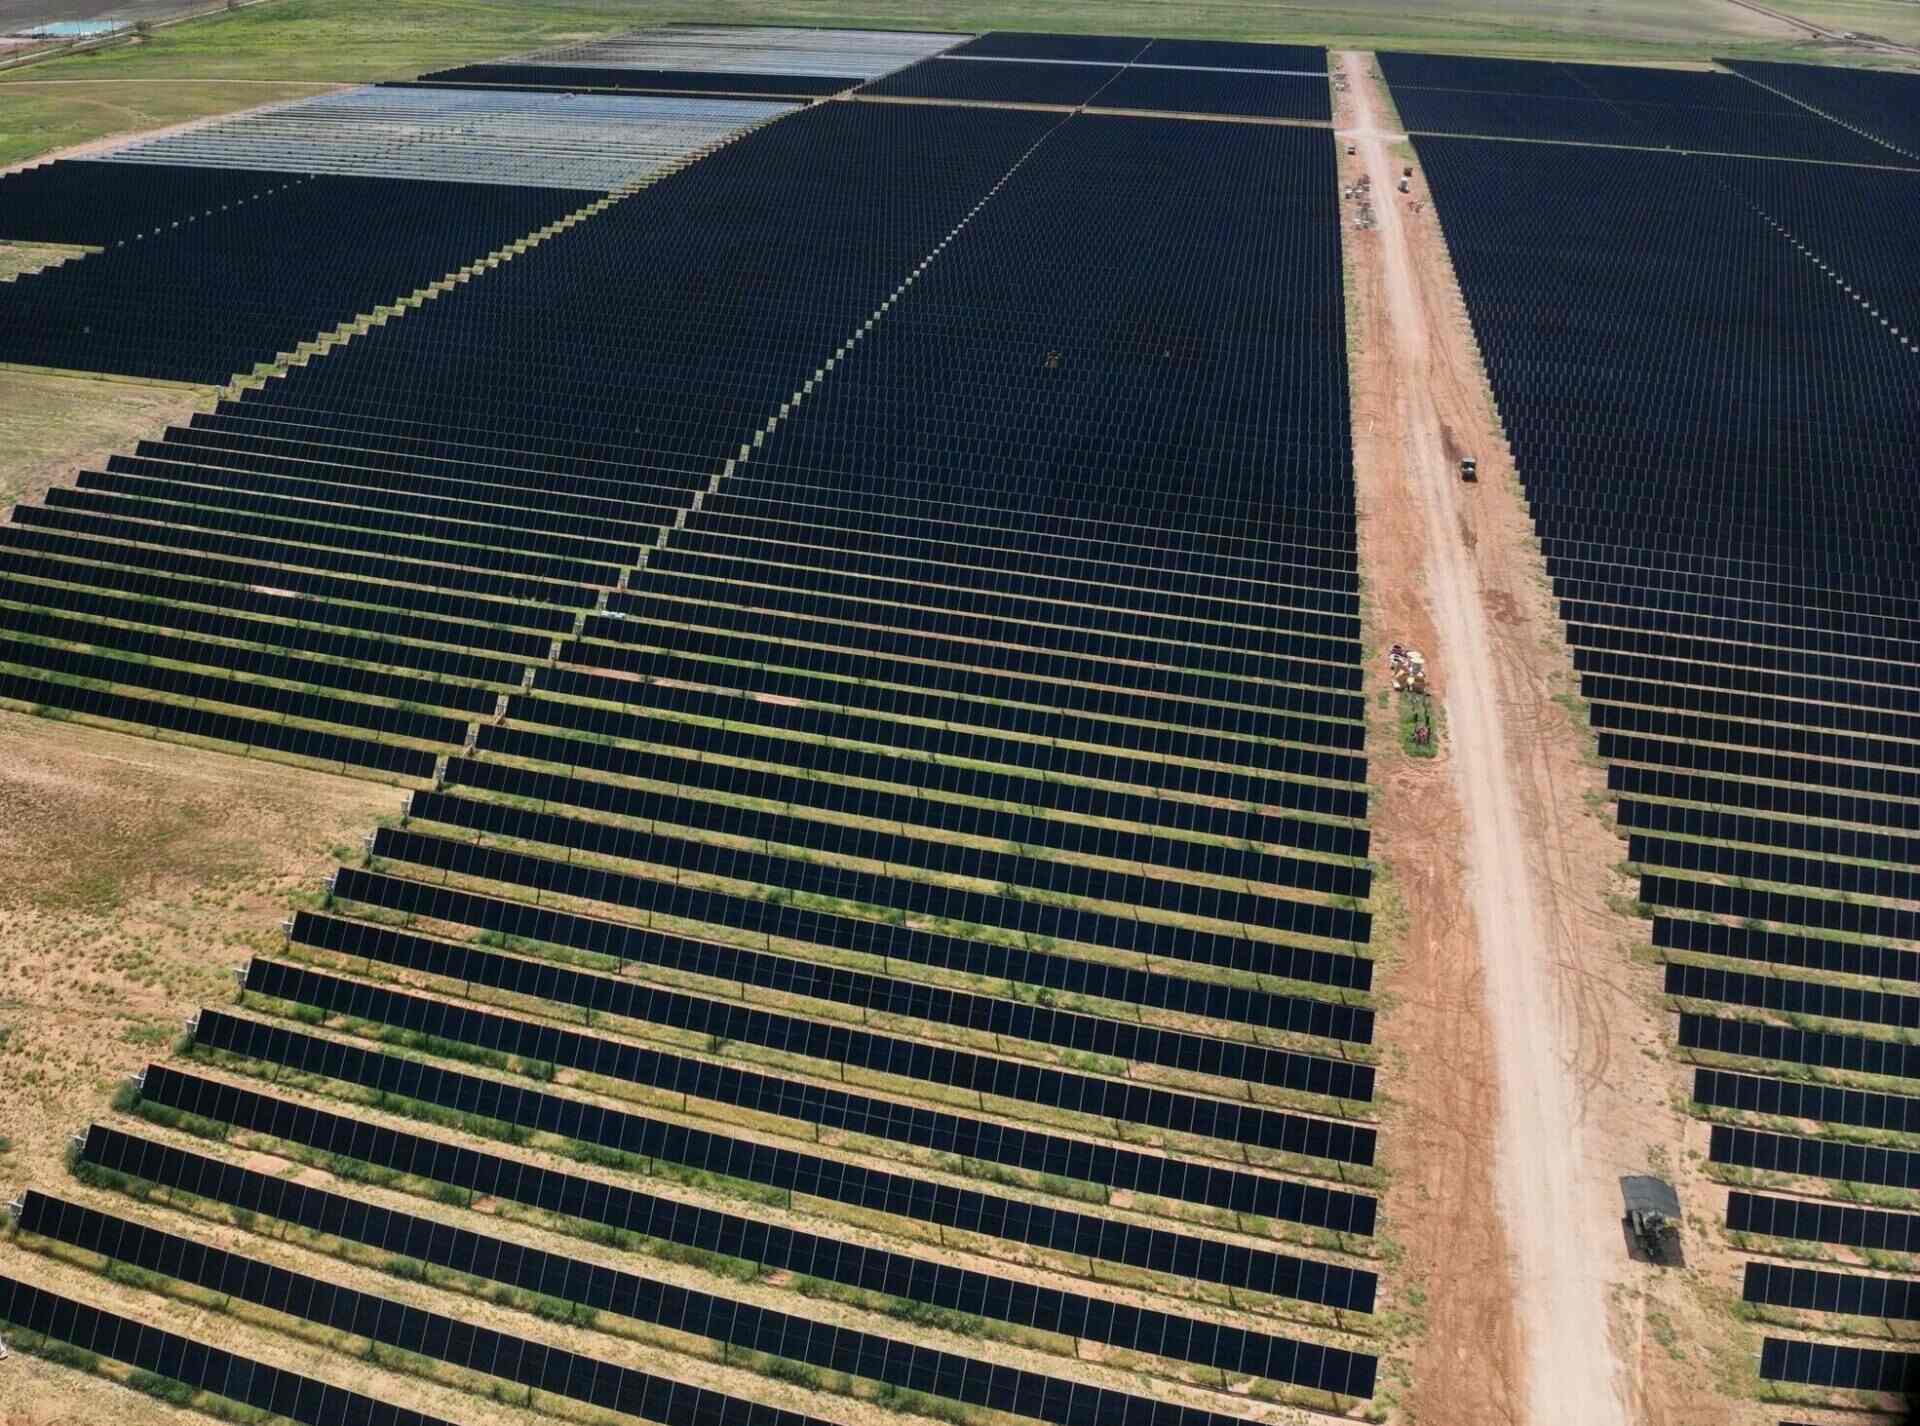
The report finds that the U.S. solar industry added 7.8 GW of new solar capacity in the first quarter of 2026 alone, surpassing 6 million total installations. Additionally, solar retained its top spot among sources of new grid additions, with photovoltaic and storage projects accounting for a staggering 91% of new capacity installed in the first quarter of the year. Right now, nearly 9% of the U.S.’s total electricity comes from solar, good for about seven times its share of the grid from just ten years ago.
Darren Van’t Hof, interim president and CEO of SEIA, says that American energy buyers have made their voices heard. As fuel prices continue to fluctuate thanks to the uncertainty around Iran’s Strait of Hormuz, the industry is turning toward secure, low-cost options that are quick to come online, and solar fits that bill perfectly.
It’s not all good news, however, Van’t Hof adds. Despite the rosy numbers for new capacity additions, the solar and wider renewable energy industry must remain vigilant of consistent political obstacles going forward. Those obstacles have caused a 27% decline year over year from Q1 2025, and a 42% decline quarter over quarter from Q4 2025.
“Yet, as power demand skyrockets, political and regulatory attacks are slowing down the exact resources we rely on,” he says. “Impeding the only sector that is actively building new power is a reckless gamble that will only drive electricity bills higher. The stakes are simply too high for Washington’s permitting gridlock to continue.”
Sluggish federal permitting has caused 457 American solar and storage projects to get caught in limbo, the report says, making them politically vulnerable. Somewhat ironically, states won by President Trump in 2024 accounted for 74% of all solar capacity installed in Q1 2026, with Texas, Florida, and solar dark horse Ohio helping to lead the charge.
Even with solar and storage taking the lion’s share of new capacity additions in Q1, the year over year numbers were far from glowing.
Declines nearly across the board
Of the 7.8 GW of capacity of new solar capacity installed in Q1 2026, 5.9 GW of that was in the utility-scale sector alone, the report says. Unfortunately, that number represents a 34% decrease year over year from Q1 2025, and a 45% decrease quarter over quarter from Q4 2025.
C&I and community solar also saw decreases year over year, according to SEIA, with both segments seeing a 4% decline in installation when compared to Q1 2025.
Of course, those numbers reflect “typical seasonality” for the solar industry, at least partially. During the winter, the industry is bound to go through a slow season thanks to poor weather in much of the U.S., the report says.
The one place where the solar market saw year over year increases in Q1 2026 was the residential sector. The report says that, while residential solar and storage installations were down 15% from Q4 2025, it saw a 6% year over year increase with about 1.18 GW installed this past quarter. Additionally, a record 45% of those residential installations came paired with battery storage, a spiking trend across the industry.
“The residential solar market grew 6% year-over-year in Q1, marking one of its strongest quarters in the past two years other than Q4 2025,” the report says. “Customer-owned projects had to be installed (not interconnected) by the end of 2025 to qualify for the Section 25D tax credit. As a result, overflow interconnections and demand supported solid installations in Q1, which is typically the weakest quarter based on residential solar seasonality.”
The residential segment is likely to see a similar decline through the rest of the year, with SEIA’s report forecasting a 21% drop in 2026. However, the long-term forecast expects “consistent growth” between 2027 and 2031.

Looking forward
The solar market is a bit uncertain right now, with installation numbers soaring compared to all other generation sources, but remaining flat when compared to 2025. Michelle Davis, head of solar for Wood Mackenzie, says the industry still has some political storms to weather before things begin truly looking up.
“We are forecasting that U.S. solar additions will be flat over the next five years despite the need for more power supply in the U.S.,” she says. “We’ve seen a notable increase in solar procurements in utility resource planning, but current permitting bottlenecks continue to serve as near-term headwinds.”
Still, the wider American solar pipeline is strong, the SEIA report says. When looking at 2027 and beyond in the U.S. solar industry, the new report expects average additions of 43 GW per year, over the next five years.
The SMI’s wider outlook for the future of the industry changed “minimally” since its last report in March. Wood Mackenzie estimates more than 200 GW worth of safe harbored solar capacity that is currently underpinning near-term installation numbers.
“Interconnection queue timelines have improved slightly but permitting bottlenecks and lengthy equipment timelines continue to serve as headwinds,” the report says. “Demand growth projections remain strong, which has started to translate into higher solar procurements in utility resource plans (particularly after 2030), but with considerable variability across the country.
“And while the solar industry has strong market fundamentals, it will take time to adjust to a post-tax-credit world, particularly for the distributed segments, which we forecast will decline in 2026.”