
Report: U.S. data center development slows in Q1
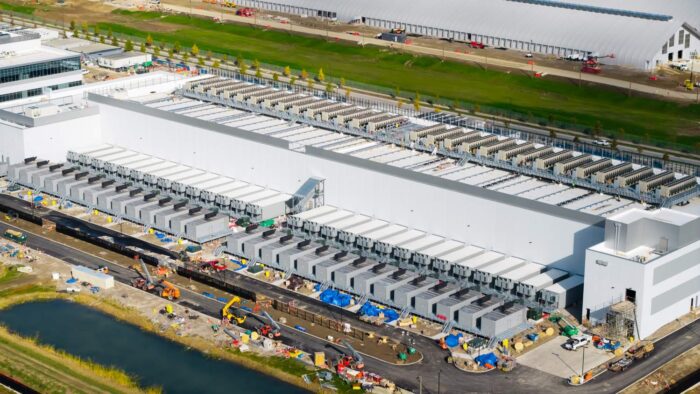
Data center development has slowed in the United States, according to a new report. However, capacity continues to grow at a slower pace.
Developers added 36 GW of new data center capacity to the U.S. pipeline in Q1 2026, according to a new report from Wood Mackenzie. Data center additions were down 19% from Q4 2025, as as the analysis showed that established developers shifted attention to their existing project pipelines amid a more challenging development and regulatory environment.
Cumulative U.S. disclosed data center capacity now totals 331 GW, of which approximately 40% is under active development, according to Wood Mackenzie’s U.S. data center pipeline Q2 report.
“Established data center developers continue to shift their focus to the maturation of their existing pipelines in the face of an increasingly challenging development and regulatory environment,” says Caitlin Connelly, senior analyst at Wood Mackenzie. “New entrants focused on gas supply and land access are targeting states such as Texas and Utah, but only a small fraction of those projects are under active development.”
Development continues to grow, but at slower pace
The 36 GW added in Q1 2026 represents a 19% decline quarter-on-quarter, extending a sustained deceleration that has now run for three consecutive quarters, Wood Mackenzie reports. Quarterly additions peaked at more than 60 GW in Q3 2025, before falling in Q4 2025 and declining further in Q1 2026.
Texas leads all states in cumulative planned capacity, now totaling nearly 100 GW, with Ohio maintaining its position as the second-largest market. Massive sites are also being planned in states such as Utah, New Mexico and West Virginia, where land availability is a key draw, though only a small fraction of these projects have moved into active development.
While 53% of projects have now passed permitting phases, this cohort represents just 32% of total pipeline capacity, underscoring the gap between project count and scale. Projects entering construction in 2026 are less energy dense than those in earlier stages.
Utility commitments exceeds 195 GW
Large load capacity with signed construction or electricity supply agreements now totals 195 GW, equivalent to 26% of 2025 U.S. peak load, according to the report. One of the more telling signals of pipeline maturity is the sharp growth in advanced discussion phases, which expanded from 37 GW in Q4 2025 to 107 GW in Q1 2026, indicating that early-stage projects are progressing toward signed commitments. At the same time, uncommitted capacity rose substantially in the quarter, driven primarily by utilities in ERCOT.
Of the high confidence load, commitments from wires-only utilities account for 51% of high-confidence utility commitments. The composition of total commitments, however, varies considerably by region. In PJM, over a third of the utility commitment pipeline is classified as high confidence, while in ERCOT, 86% of commitments remain speculative or in early-stage study phases. This imbalance leaves PJM most exposed to the risk of large load pipelines exceeding what its reliable generation queue can support.
Capex breaks $1 trillion milestone
Disclosed capex associated with specific projects crossed the $1 trillion USD threshold in Q1 2026, though the figure is heavily skewed by a small number of large, speculative developments, according to Wood Mackenzie. Just 6% of projects account for 42% of total capex, highlighting how concentrated investment has become at the top of the market. Per-MW costs declined in Q1 2026, continuing the reversal from H2 2025 highs, and per-square-foot costs also fell following a spike in 2025. Average building square footage is rising even as overall campus square footage declines, pointing to a broader industry shift toward fewer, larger and more capital-intensive facilities.
Around-the-meter generation strategies gaining ground
A growing number of pipeline projects are disclosing around-the-meter (ATM) generation strategies, and the trend is most pronounced in Texas, where strong gas supply, faster permitting timelines and a robust renewables market create favorable conditions. Across disclosed around-the-meter deployments, gas accounts for 40% of projects and 48% of total site capacity, while renewables and storage represent 41% of deployments and 38% of capacity — a balance that reflects both the urgency of securing power and a longer-term interest in cleaner supply.
“The regulatory environment for data center development is increasingly complex and regionally diverse. Interruptible service options are being deployed, forcing companies to choose between speed-to-power and firm power,” Connelly says. “Policymakers tend to view firm service as an unnecessary friction to interconnection.
“Fast-track capacity interconnection frameworks seek to bring new generation online quickly ahead of a supply crunch. It remains to be seen whether policy developments help or hinder demand growth, however, as policymakers seek to balance the often-competing priorities of affordability and speed to power.”


Comments are closed here.