Solar power production anomalies continued to rise in 2021 according to Raptor Maps
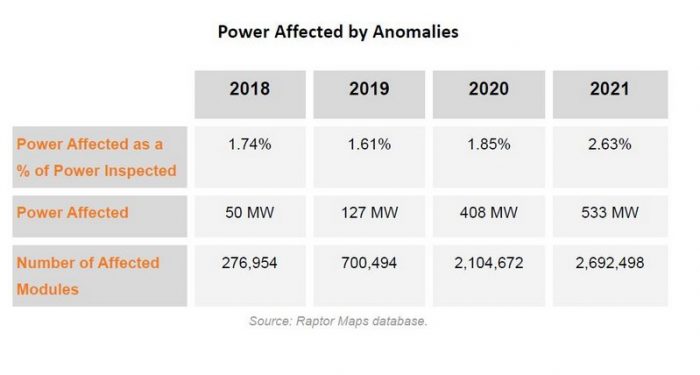
Large-scale solar power production anomalies continue to rise, according to the fourth annual report on global PV system underperformance from Raptor Maps. The company used machine learning to analyze 2021 data from aircraft inspections across 20 GW of utility and C&I solar PV systems and saw a fairly big increase in solar power affected from anomalies, rising to 2.63% in 2021 from 1.85% in 2020. That’s more than 100 MW of energy production impacted.
“Our inspection data shows that solar assets are becoming more anomalous each year,” explains Eddie Obropta, CTO and co-founder of Raptor Maps. “These findings against the backdrop of increased costs of capital and supply chains underscores the need to use advanced technology to maximize power output. Operational excellence is no longer enough. Solar financiers, asset owners and asset managers must leverage data and analytics to make intelligent decisions that reduce soft costs.”
According the report, this increase is driven by a mix of string, inverter, combiner, module and tracker anomalies. The proprietary dataset spans 66 million modules in 32 countries including those from a range of installation types, geographies and climates. JinkoSolar, First Solar, Trina, Canadian Solar, JA Solar and Hanwha were the most common manufacturers in the dataset along with other BloombergNEF Tier-1 modules.
Classifications in the report span:
- functional units including off-nominal inverters,
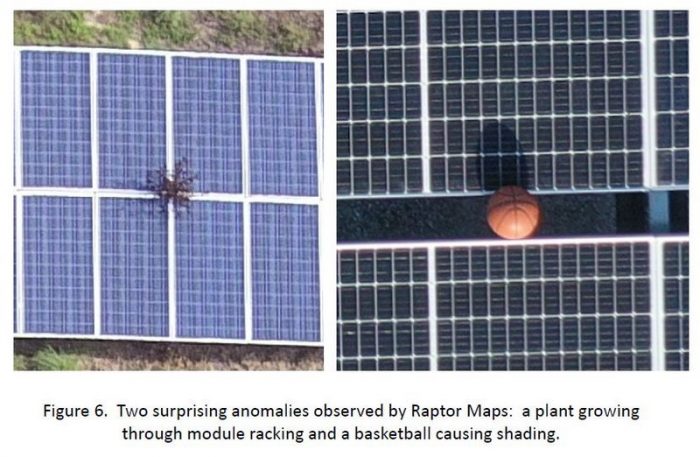
- environmental conditions including overgrown vegetation and
- module or sub-module findings including activated bypass diodes.
The report breaks out the most common PV anomalies at the system level and at the module or sub-module level.
Awareness of these anomalous issues is growing too.
Raptor Maps’ report finds that companies sought more in-depth inspections data in 2021. The percentage of drone inspections that were Comprehensive — the most granular inspection level — increased from 21% in 2020 to 24% in 2021. Increasingly more parties are also accessing PV inspection data. Inspection data owners shared findings with an average of 27 additional users in 2021 — indicating increased communication and collaboration.
In the solar energy industry, aerial inspections are used across all phases of the solar lifecycle at greater frequency. Asset owners and engineering, procurement and construction companies require inspections during commissioning to de-risk assets, remediate issues, create a quantitative baseline and avoid liquidated damages.
Operations and maintenance companies integrate aerial inspections into annual preventive maintenance as the owner-preferred alternative to current-voltage (I-V) curve tracing. Counterparties — including module manufacturers, engineers, financiers and others — also use aerial inspections for warranty claims, insurance claims, project benchmarks, due diligence and more.


Comments are closed here.